
Two batters each score 100 runs. One has an average of 50; the other averages 25. With the same run total, the difference comes from the number of dismissals in the selected sample. Their strike rates can also differ because they faced different numbers of balls.
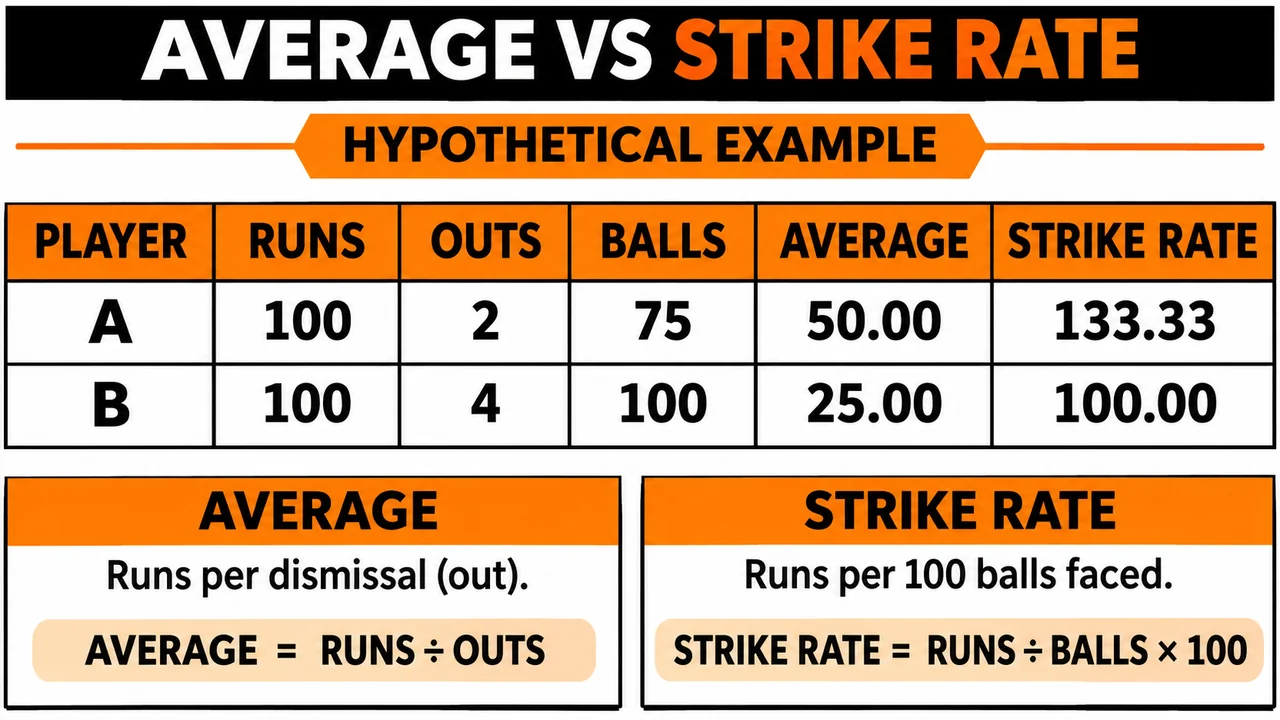
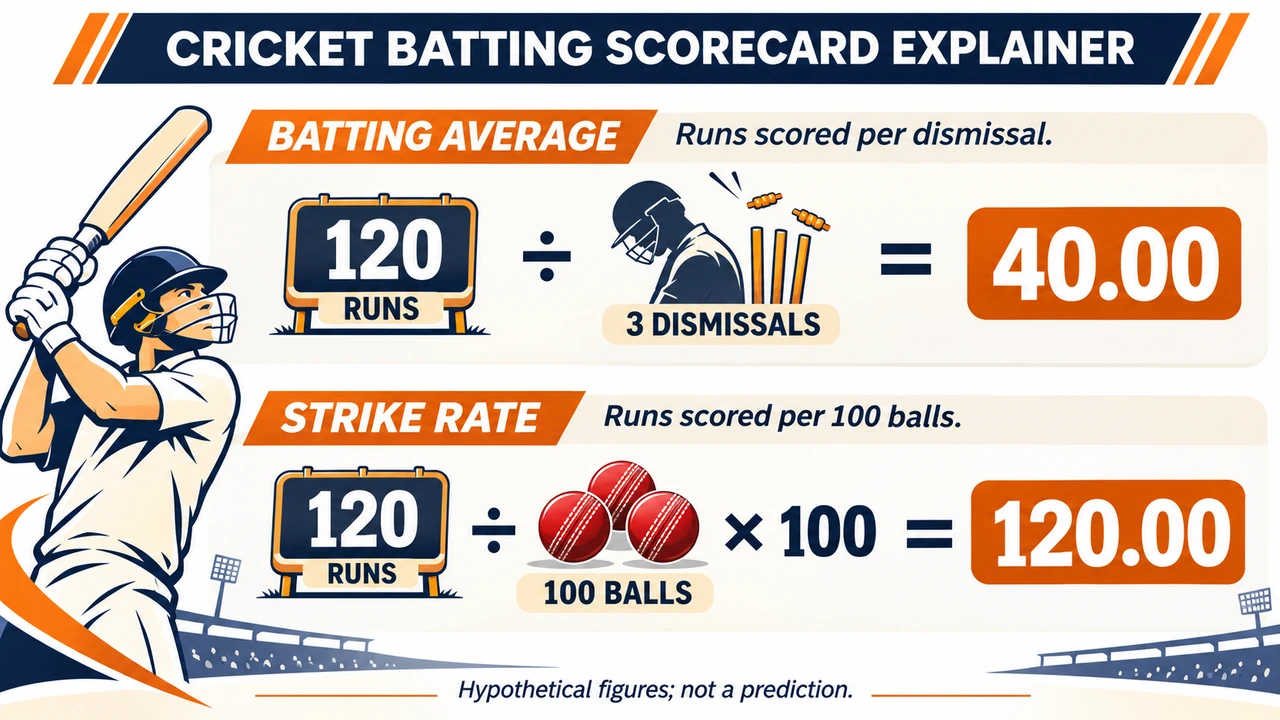
Batting average is runs divided by dismissals. Batting strike rate is runs divided by balls faced, multiplied by 100. Read both with the number of innings, not-outs and balls before deciding what the figures actually describe. Neither tells you who will score more in the next match.
Start with the denominators
The batting average asks how many runs a batter has scored for each recorded dismissal in the selected period. An innings in which the batter remains not out contributes runs but does not add a dismissal to the denominator. The Association of Cricket Statisticians and Historians discusses why not-outs are part of that convention.
Strike rate asks how quickly the batter scored relative to the balls faced: runs × 100 ÷ balls. The association’s guidance on The Hundred refers to scoring rate per 100 balls in that competition. The ICC also reports batting strike rates alongside runs and balls faced. A higher rate means more runs per 100 recorded balls in that sample; it does not tell you how long the batter remained in or whether the team won.
Work through two hypothetical batters
Consider the following invented figures for a clearly defined set of innings. They are not a comparison of actual players.
| Measure | Batter A | Batter B |
|---|---|---|
| Runs | 100 | 100 |
| Innings batted | 3 | 4 |
| Not out | 1 | 0 |
| Dismissals | 2 | 4 |
| Balls faced | 75 | 100 |
| Batting average | 50.00 | 25.00 |
| Strike rate | 133.33 | 100.00 |
For A, the average is 100 ÷ 2 = 50.00. The strike rate is 100 × 100 ÷ 75 = 133.33 when rounded to two decimal places. For B, the corresponding calculations are 100 ÷ 4 = 25.00 and 100 × 100 ÷ 100 = 100.00.
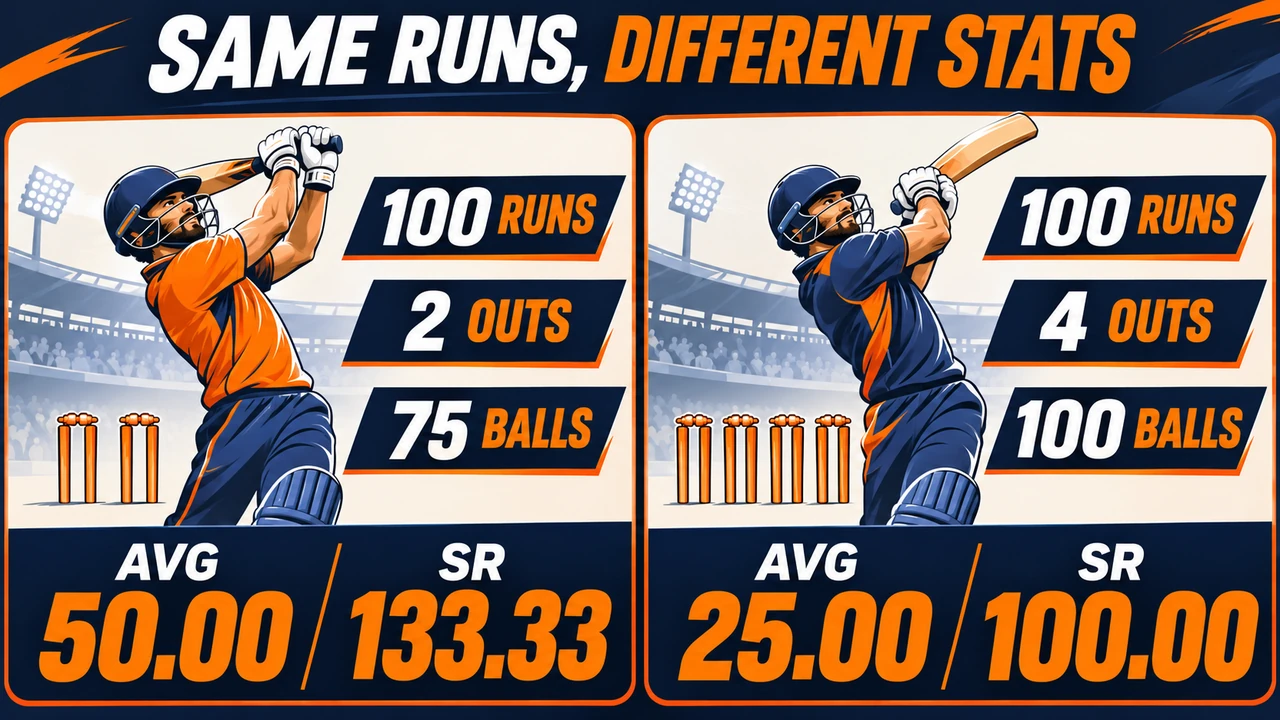
In this example, A has both the higher average and the higher strike rate. That does not tell us which innings mattered more to a match. These figures do not show the match situation, batting position or opposition. The samples are small and have different innings counts. A fuller assessment needs those details rather than one number promoted into a complete ranking.
Apply the calculation to two reported innings
The ICC reported Virat Kohli’s 51 from 43 balls against Sunrisers Hyderabad and an unbeaten 70 from 44 against Gujarat Titans in the 2024 IPL. Taken together, these two innings comprise 121 runs from 87 balls: 121 ÷ 87 × 100 gives a combined strike rate of 139.08. Add the runs and balls first rather than averaging the two innings’ strike rates directly; the innings contain different numbers of balls. This is a selected two-innings calculation, not a season or career rate.
The report establishes that the second innings was not out. Check the full scorecards for both dismissal statuses before calculating a batting average for this sample; the strike rate alone cannot supply that denominator.
What if the batter has never been out?
Suppose a batter scored 35 runs across two innings and was not out in both. The dismissal count is zero. Dividing 35 by zero is undefined, so there is no finite batting average to calculate for that sample. A provider may show a dash or another display convention; do not turn that absence into an average of zero.
Strike rate can still be calculated if balls faced are recorded and the count is greater than zero. If those 35 runs came from 25 recorded balls, the strike rate would be 140.00. That is a separate calculation; it does not fill the missing average.
If balls faced are zero or unavailable, do not calculate a strike rate either. Missing data and a zero value are different: a scorecard that does not supply a ball count has not established that the batter faced no balls.
Compare a like-for-like sample
Before comparing published figures, record the competition, format, dates and innings included. Use compatible definitions from the same source where possible, especially when aggregating older scorecards with incomplete ball-by-ball records. A player’s role can also change the question: an opener and a late-innings finisher may have different time and opportunities to bat.
The cricket data tables guide looks at putting definitions and samples beside a comparison. The player data guide covers the wider role and source context; the scorecard guide explains where to start with an innings record.
Batting statistics FAQ
Does a not-out innings count towards batting average?
The runs from it are included in the numerator, while that innings does not add a dismissal to the denominator. This can materially affect the result in a small sample.
Is a strike rate of 133.33 a percentage of balls hit?
No. It represents runs scored per 100 recorded balls faced in the selected sample. It is not a percentage of successful shots or a probability of scoring.
Can a batter have a strike rate but no batting average?
Yes. With recorded runs and a positive ball count but no dismissals, a strike rate can be calculated; the batting average remains undefined because its denominator is zero.
Does a higher average prove a batter is better?
No. It describes runs per dismissal in the selected sample. Compare the format, sample size, role and match context, and decide which question the comparison is meant to answer.
Sources and method
Prepared for Vegas11 using AI assistance. The statistics definitions and reported innings are linked above; the A/B comparison is hypothetical. Calculations were checked against the stated figures, and the two-innings strike rate is a calculation for that selected sample.